Before introducing the framework's monitoring alerts, we cannot avoid introducing industry standard observability and the design and specifications of OpenTelemetry concerning monitoring alerts. OpenTelemetry has a lot of content on this front, and we will highlight some key points.
OpenTelemetry
Related Components
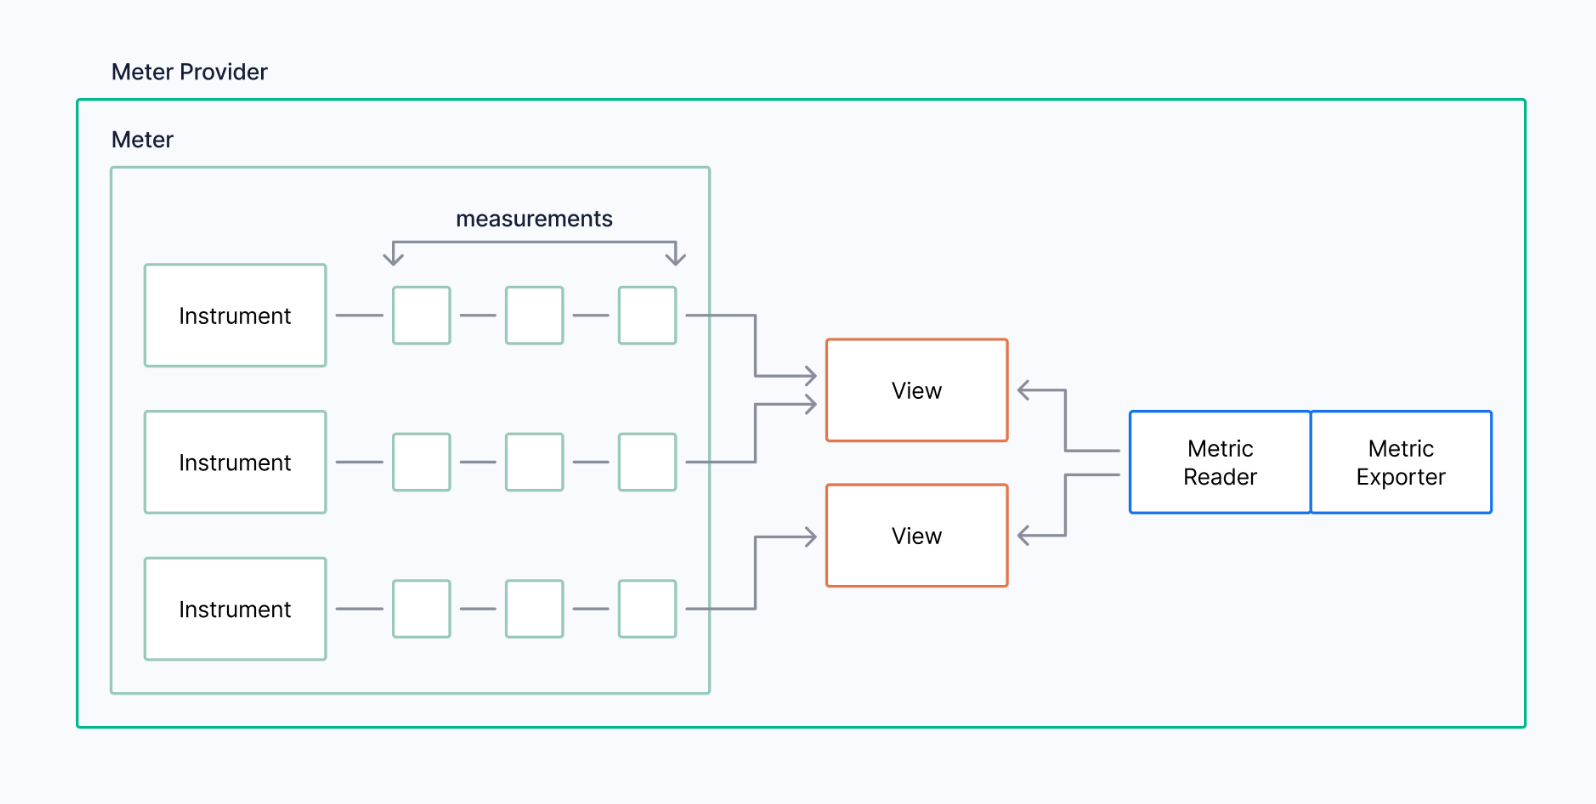
Let's look at a diagram showing the relationships between OpenTelemetry components. In the implementation of the OpenTelemetry Metrics standard, the following components are primarily included.

In the implementation of standardized documentation, each component is typically designed using interfaces to enhance scalability:
Meter Provider
Used for interfacing with global management of Meter creation, akin to a global monitoring metrics management factory.
Meter
Used for interfacing with the creation and management of global Instruments. Different Meters can be regarded as different program components. For example, various components in a framework can be seen as different Meters, like gclient and ghttp being two different Meters.
Instrument
Used to manage the various types of metrics under different components, such as http.server.request.duration, http.server.request.body_size, etc., under ghttp.
Measurements
The specific DataPoint metrics data reported for metrics, consisting of a series of numerical items.
View
Implements operations like calculation, aggregation, filtering, and modification on Measurements. Since metrics are usually numerical types, the default View is typically used.
Metric Reader
Used for implementing data flow readings of metrics and defining specific metric data structures internally. The OpenTelemetry community provides various flexible Reader implementations, such as PeridRader, ManualReader, etc.
Metric Exporter
The Exporter is used to expose local metrics to corresponding third-party vendors and define whether data transfer is push or pull. Exporter leverages Reader, and while there are only several ways for Reader, Exporter varies by vendor, with many available, such as prometheus, zipkin, etc.
The data flow of multiple DataPoints for one Instrument is shown below:

Related Types
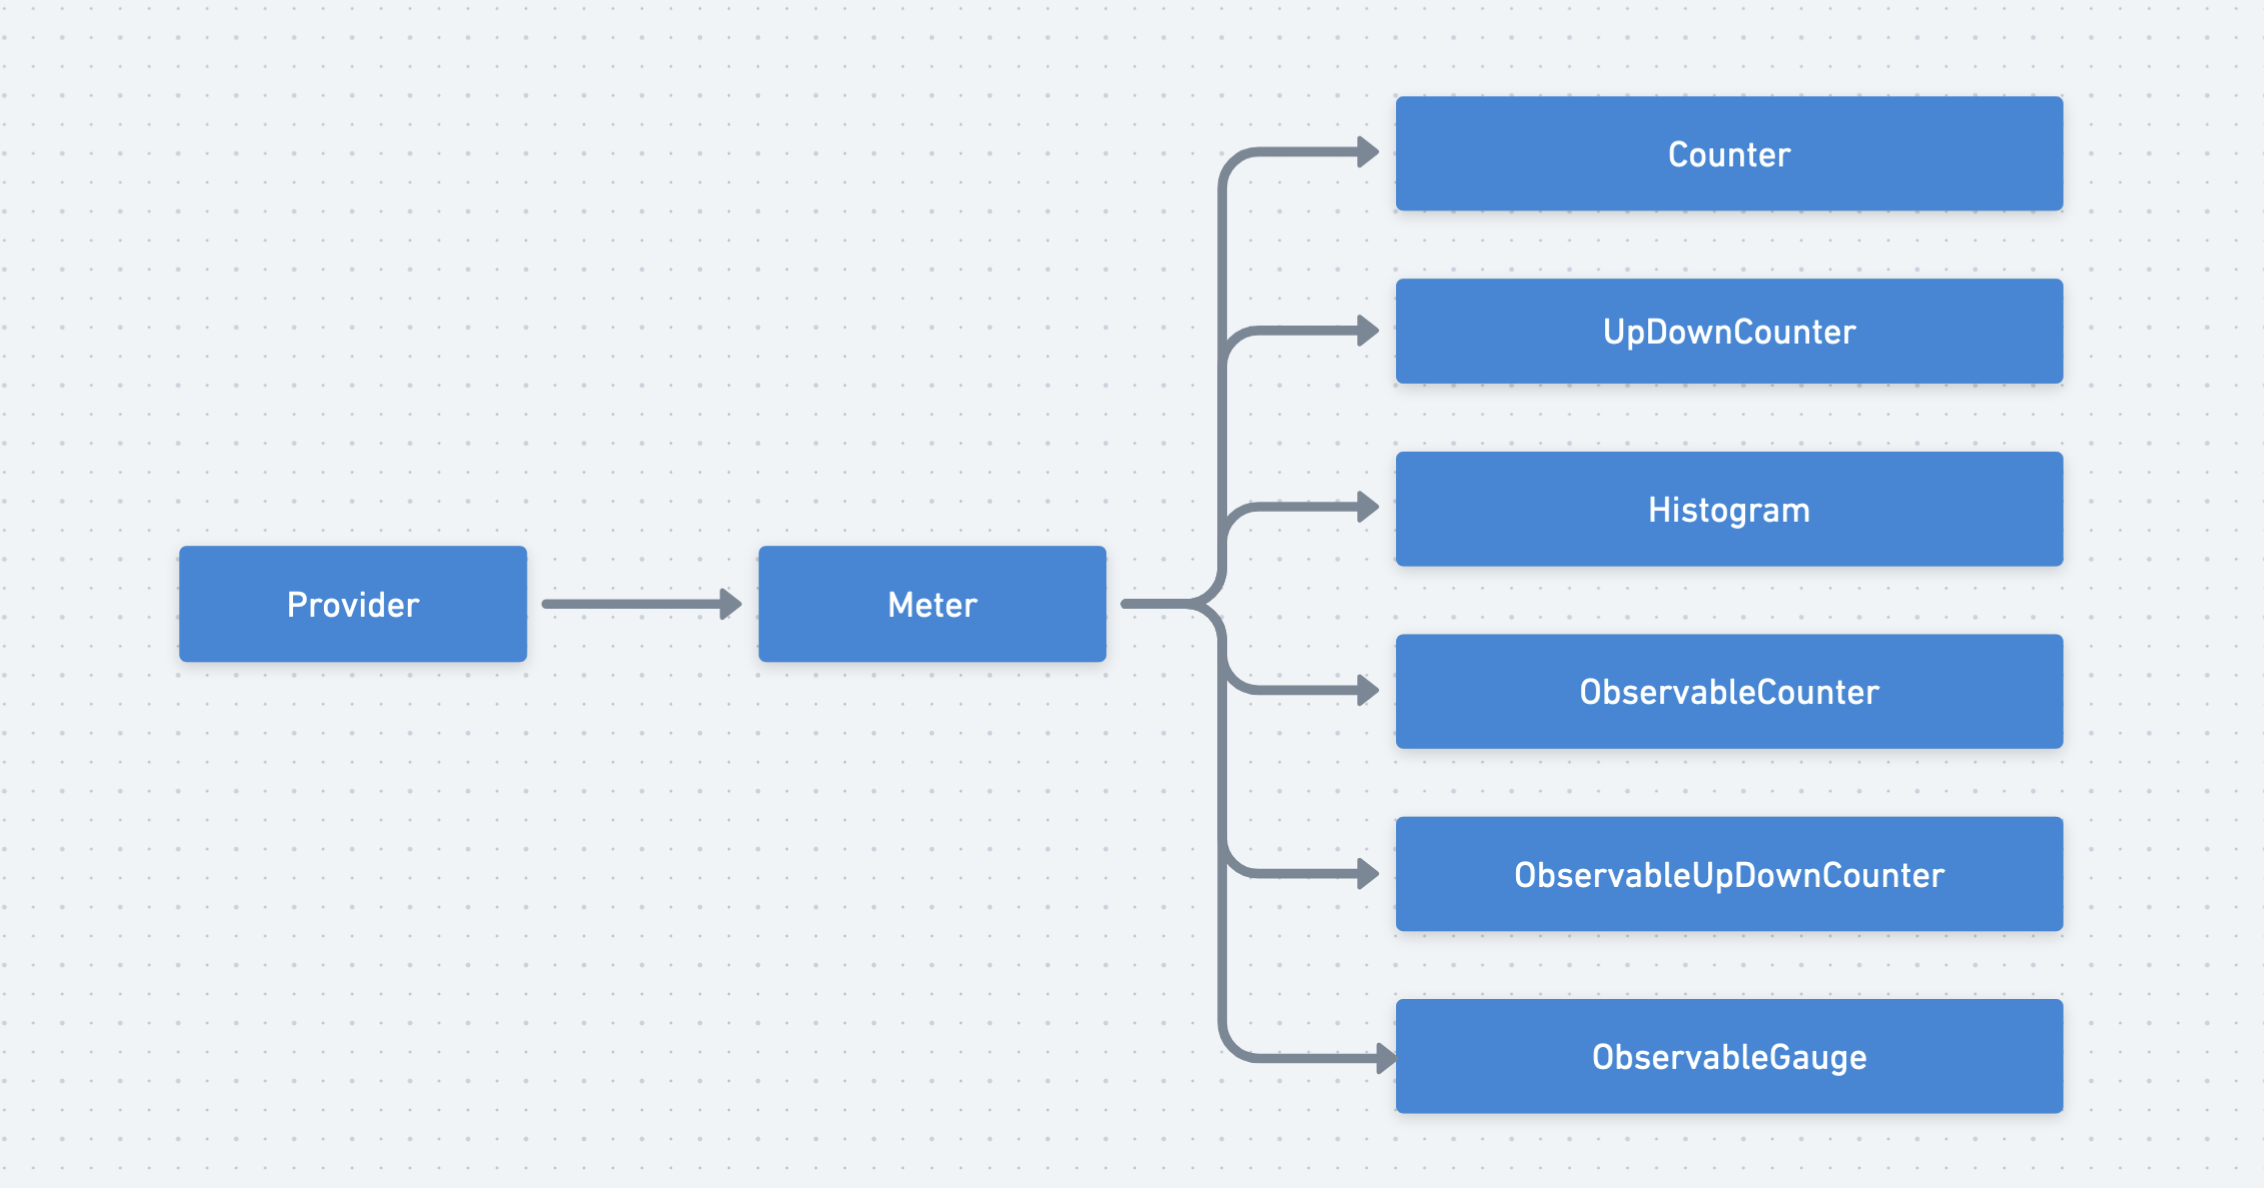
The OpenTelemetry community implementation aims to meet various usage scenarios, hence the detailed granularity of type designs. It includes int64 and float64 data types and encompasses both synchronous and asynchronous metric types.
Synchronous Types
Synchronous types are used for promptly exposing monitoring metrics. Regardless of whether the metrics reader employs the metric, the calculation results are completed and ready for reading. For example, HTTP request total count and request size must be recorded in the monitoring metrics during the request execution flow, making them suitable for management as synchronous metrics.
| Type | Description | Example |
|---|---|---|
Int64Counter | int64 metrics that only increase. | Total request count, total request byte size |
Int64UpDownCounter | int64 metrics that can increase or decrease. | Current active requests, execution queue size |
Float64Counter | float64 metrics that only increase. | Total request count, total request byte size |
Float64UpDownCounter | float64 metrics that can increase or decrease. | Total request count, total request byte size |
Int64Histogram | int64 metrics that can be grouped. | Request execution time p99 |
Float64Histogram | float64 metrics that can be grouped. | Request execution time p99 |
Asynchronous Types
Monitoring metrics of asynchronous types execute metric calculation logic only when the metrics reader begins using the metric. Asynchronous-type metrics require a callback function that generates metric values, triggering only when the metrics reader reads the metric. For examples like machine CPU, memory, and disk usage metrics, if there's no pulling or use by the target end, pre-calculating metric values is meaningless and wastes computing resources, making them suitable for management as asynchronous metrics.
| Type | Description | Example |
|---|---|---|
Int64ObservableCouter | int64 metrics that only increase. | CPU, memory, disk usage |
Int64ObservableUpDownCounter | int64 metrics that can increase or decrease. | CPU, memory, disk usage |
Float64ObservableCouter | float64 metrics that only increase. | CPU, memory, disk usage |
Float64ObservableUpDownCounter | float64 metrics that can increase or decrease. | Current active requests, execution queue size |
Int64ObservableGauge | int64 metrics that can increase or decrease. | CPU, memory, disk usage |
Float64ObservableGauge | float64 metrics that can dynamically increase or decrease. | CPU, memory, disk usage |
Framework Monitoring Components
Component Abstraction
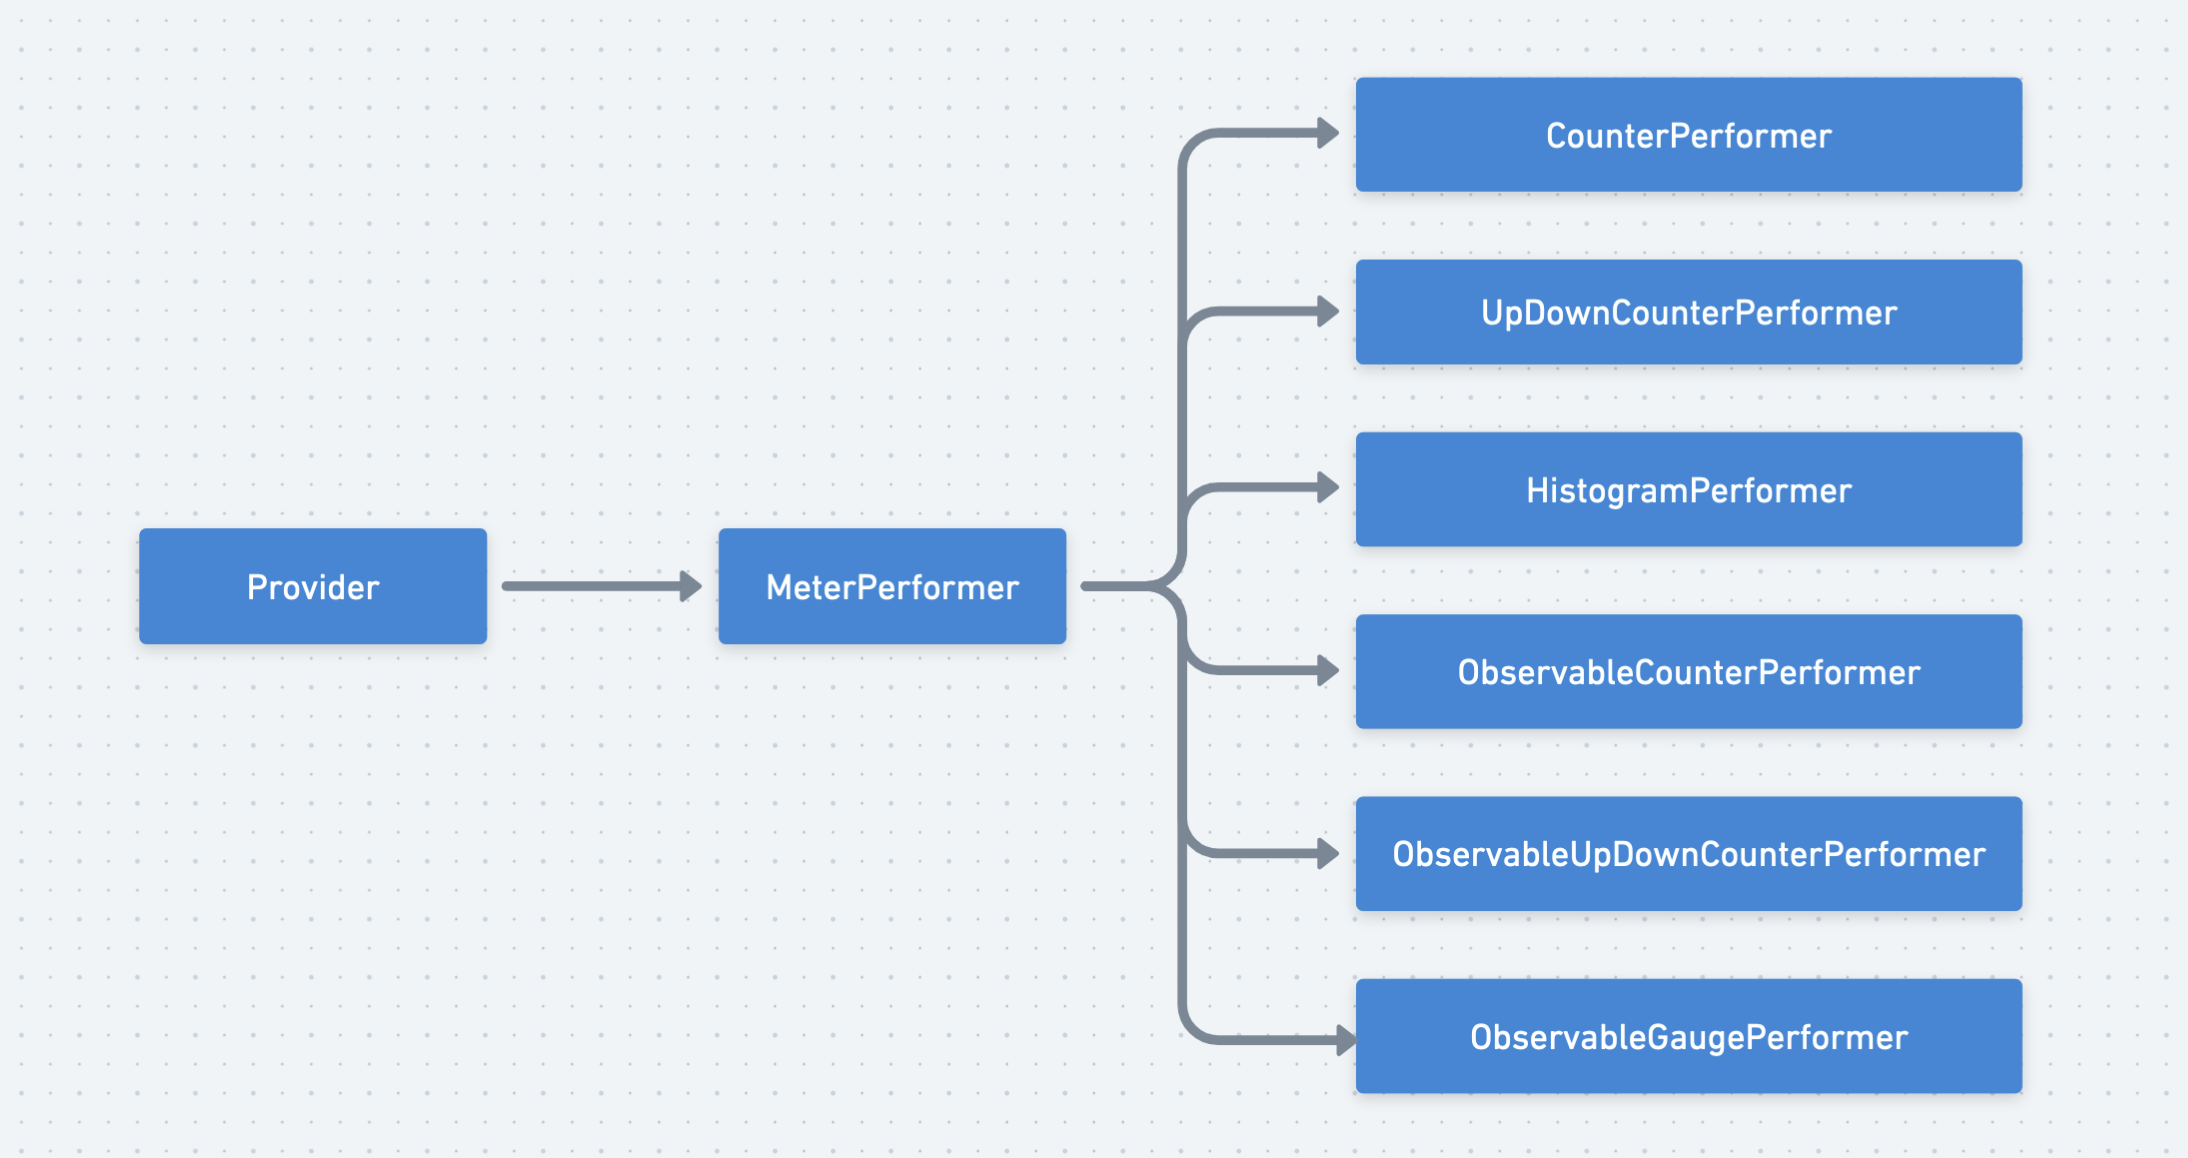
The framework achieves monitoring capabilities through the gmetric component, with its internal component hierarchy design similar to OpenTelemetry Metrics:

The gmetric component employs an abstract decoupling design, partly because the framework aims to reduce external dependencies and partly to achieve automatic switching of monitoring capabilities. By default, the component uses an implementation object of NoopPerform, where monitoring capabilities are disabled; they automatically enable once a monitoring interface implementation is introduced.

Metric Types
The metric types provided by the framework simplify by removing the int64 numerical type in contrast to OpenTelemetry, using a unified float64 numerical type. However, it is crucial for developers to avoid designing values as decimals to prevent precision issues. This is particularly vital in Histogram type Buckets design, where using decimals is not recommended.
Synchronous Types
| Type | Description | Example |
|---|---|---|
Counter | float64 metrics that only increase. | Total request count, total request byte size |
UpDownCounter | float64 metrics that can increase or decrease. | Total request count, total request byte size |
Histogram | float64 metrics that can be grouped. | Request execution time p99 |
Asynchronous Types
| Type | Description | Example |
|---|---|---|
ObservableCounter | float64 metrics that only increase. | Total request count, total request byte size |
ObservableUpDownCounter | float64 metrics that can increase or decrease. | Total request count, total request byte size |
ObservableGauge | float64 metric that can dynamically increase or decrease. | CPU, memory, disk usage |